All u-Slicer Functions
This section aims to outline all of the features available in u-Slicer and where you can find out more about on each.
Add Custom Data Columns u-Slicer lets you add your own custom columns where you can define the function that returns the data, see Adding custom data columns
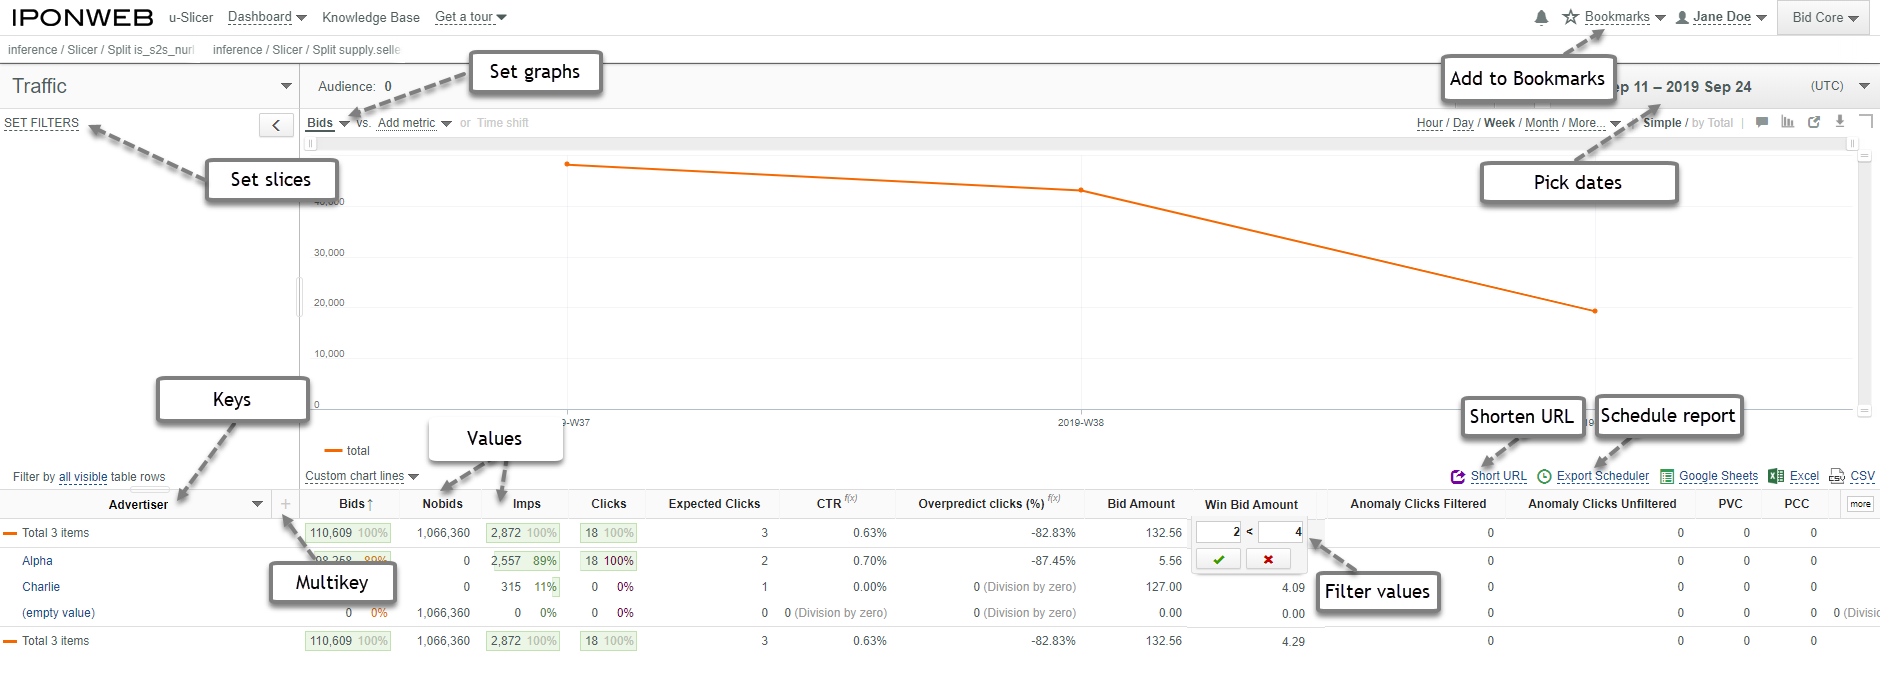
Calendar The calendar function lets you select the date range for which data is returned. Note: The data can only go back as far as the initial deployment date.
Chart Types You can display your charts using area, column, line, or line + column charts, use the assessment button to display the options
Chart as Image Download You can download an image of any graph you generate, in one of the following formats: pdf, svg, png, jpg, use the arrow_downward button to display the options
Custom Chart Lines Using these you can overlay a line on the graph for one of the following functions: SimpleMovingAvg, Trend, Integral
Standalone Chart You can display a graph in a standalone window by selecting the content_copy button
Column Drag and Drop You can drag and drop columns in the u-Slicer interface, which can be useful to put related figures closer together for analysis
Confidence Range The confidence range refers to how accurate the reported figures are. This is due to the data compression mechanism applied to improve performance when processing huge data volumes.
Data Filtering You can filter data to see what values are given for the selected data type, for example,
language, device type, site.Data Sort You can sort each report by one data column. To do this use the filter arrow that appears beside each column header on hover arrow_downward, the arrow remains displayed beside the sorting column
Export Functions You can export the data underlying each report to CSV, Excel, or Google Spreadsheets
Metric Comparison You can plot two metrics on the chart function, and see if they are in some way correlated
Short URL Generator You can generate short URLs for sharing a report more easily amongst those with access to the u-Slicer instance, use the short URL button
Saving Charts You can save a chart that you have generated for future reference by adding it to your u-Slicer bookmarks. Select the star_border on the page header to add a chart to your bookmarks
Scheduled Reports You can set up scheduled reports from the UI, see the Schedule regular mailing
Time Granularity u-Slicer lets you configure the time period which is applied to each data point. The options available are: Day & Hour, Day, Week, Month, Quarter, and Year.
Time Shift You can overlay two sets of data, separate by a time period, the Time Shift option can be configured based on the Time Granularity setting.